Skip to content

Crude Oil Peak

Menu
  • Home
    • About
    • Disclaimer
  • OECD imports
    • France
    • Germany
    • Italy
    • Japan oil imports
    • OECD Europe
    • OECD Pacific
    • South Korea
    • UK
    • US Imports
  • Australian graphs
    • Australian electricity supply graphs
    • Australian crude oil production
    • Australian crude oil reserves
    • Oil import dependency
    • Oil and fuel imports
    • ULP prices
    • Industry stocks
    • End use of oil
    • WA crude oil
    • WA domestic gas
    • East coast conventional gas
    • Geoscience Australia March 2010
    • Geoscience Australia 2005/2006
    • Gippsland
    • LPG
    • Petrol rationing in WW2
  • Oil reserves
    • OPEC paper barrels
    • Kuwait Reserves
    • Strategic Oil Reserve
  • Global Peak
    • Algeria peak
    • Angola peak oil
    • Argentina peak
    • Azerbaijan peak
    • Brazil
    • Brunei peak
    • Canada and tar sands
    • Caspian peak
    • China Peak Oil
    • Deepwater peak
    • Egypt
    • Gabon peak
    • India peak oil
    • Indonesia peak
    • Iran Peak
    • Libya peak oil
    • Malaysia-peak
    • Mexico peak
    • Norway peak oil
    • Qatar peak
    • Russia peak
    • Saudi Arabia export peak
    • Sudan Peak
    • Syria
    • Tunesia
    • UAE peak
    • UK Peak
    • US Peak
    • Vietnam peak
    • Venezuela peak
    • Yemen
  • Energy Transitions
    • Germany energy transition
    • Japan Energy Transition
    • UK Energy Transition
    • US
  • Fuel Shortages
    • China Fuel Shortages
    • Egypt Diesel shortages
    • India petrol price hike
    • Malawi fuel shortage
    • Nepal
    • Nigeria fuel shortage
    • Pakistan petrol shortage
    • Russia
    • Tanzania fuel shortage
    • Uganda Fuel Shortage
    • Yemen fuel shortages
  • I told you so
    • Top Ryde Shopping Centre
    • North South Bypass Tunnel (Clem7) Brisbane
    • Airportlink Brisbane
    • Cross City Tunnel
    • Lane Cove Tunnel
    • Too late for Metro tunnels
    • Australian car manufacturing closing down
    • How the first phase of peak oil brought Virgin Australia into minus after 2008
  • Solutions
    • Night trains
    • Electric Rail on Freeways
    • LNG locomotive conversion
    • Electric trolley buses
    • Walk to school
  • Oil crises
    • Oil crisis 1973
    • My experience oil crisis 1979
    • Historical Oil Disruptions
  • Food and Oil
    • Farm Costs Australia
    • Food crises and political instability
  • Global warming
    • Storms of my Grandchildren
    • Extreme weather events
    • Global warming and petrol lines
    • Compensation claims from global warming damage
    • Sea level rises
    • Why coal seam gas will not reduce CO2 emissions
Menu

WA crude oil depleted by 75 %

Posted on July 11, 2011

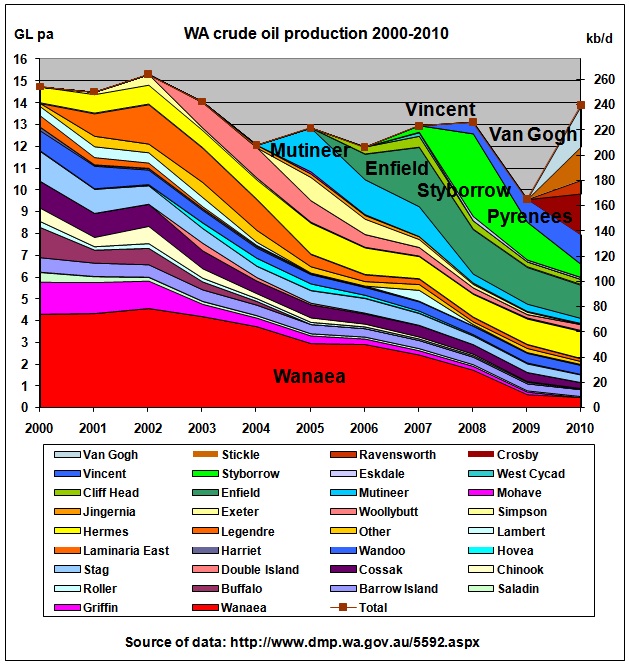
According to statistics published by the WA government in April 2011, WA’s crude oil resources including contingencies are depleted by around 75% at end 2010 up from 63% at end 2006. The annual depletion rate is therefore around 3% pa. Crude oil production in 2010 has increased from new fields (Van Gogh, Pyrenees) but the reserve/production ratios in some of these new fields are only 4-5 years. Fields which started in 2004-2008 (Mutineer, Enfield, Styborrow, Vincent) have already peaked and are in decline.
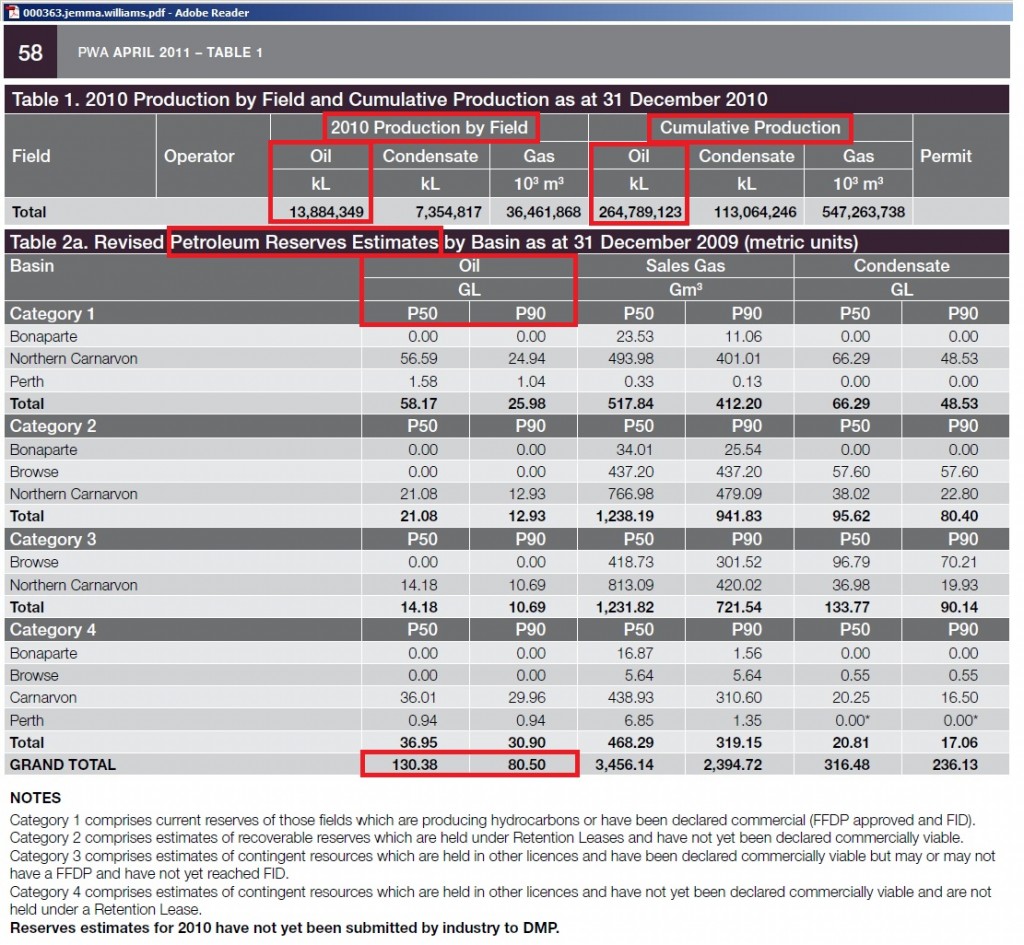
http://www.dmp.wa.gov.au/documents/000363.jemma.williams.pdf

A quick calculation from the above tables 1 and 2a:

Cumulative Production end 2010:      265 GL
P 50 resources end 2009:                   130 GL
Production 2010:                                    14 GL
Appr. resources end 2010:                  116 GL

Depletion at 50% probability = 265 / ( 265 + 116 ) = 70%

Repeating the calculation for P90

Depletion at 90% probability = 265 / ( 265 + 81 – 14 ) = 80%

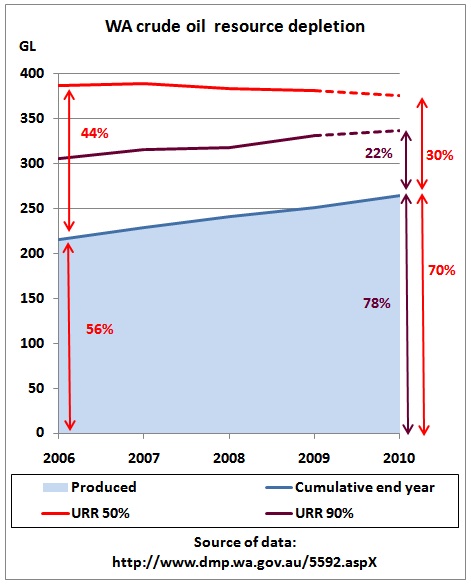
A more detailed calculation is shown in this graph using resource depletion trends in the years 2006 – 2009
Data from PWA publications: http://www.dmp.wa.gov.au/5592.aspX

P 50 resources have been declining slightly and P90 resources increasing. This means the ultimate recoverable resources (URR) will be somewhere between the 50% and 90% probabilities. Assuming that these trends have continued over 2010 we get depletion levels between 70% and 78%, the average not much different from the quick calculation above. In 2006, the P50 depletion level was only 56%, so there was an increase of 14% to 70% in just 4 years.

Here are the production profiles by field:
All data are from: http://www.dmp.wa.gov.au/5592.aspx

We see that pre-2004 fields have declined to a mere 25% of their peak in 2002 in just 8 years. New fields between 2004 and 2008 already peaked in 2008:
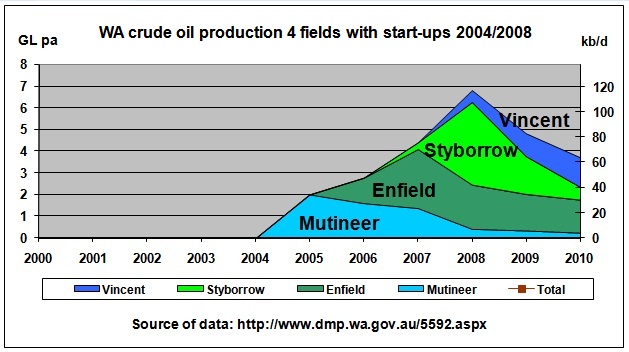
which caused a steep drop in total WA production. In 2010, new fields have come on-stream in the Pyrenees group (Stickle, Ravensworth, Crosby).
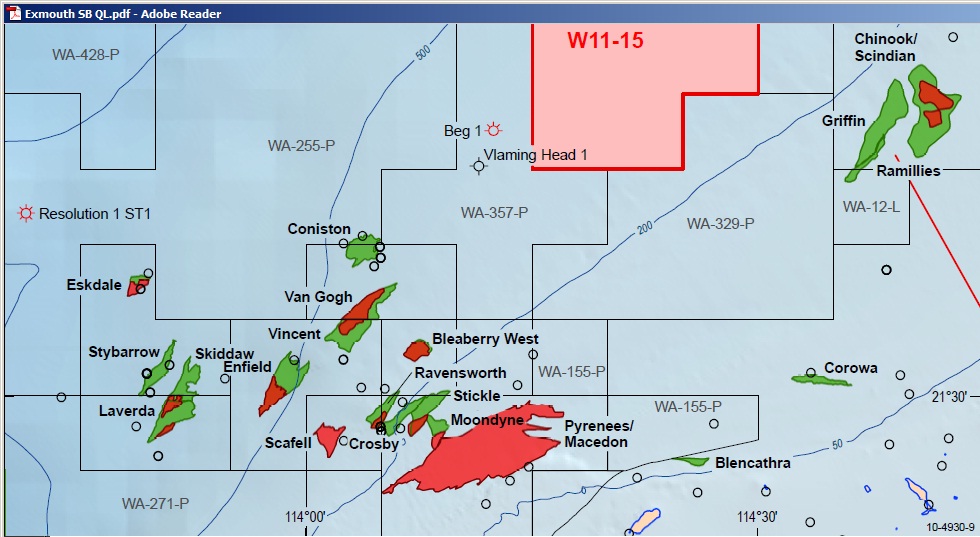
http://www.ret.gov.au/Documents/par2011/release-areas/carnarvon/documents/exmouth-sb/Geology%20Exmouth%20Sb.pdf

In PWA September 2008, Stickle had P50 reserves of 5.565 GL. With a 2010 production rate of 1.5 GL the reserve/production ratio would only be 5.6/1.5=3.7 years. For Crosby the R/P ratio would be 9.2/1.9=4.8 years. Unfortunately, PWA no longer publishes reserves/resources by field and Ravensworth was not included in PWA Sep 2008. But with estimated recoverable reserves of 80-120 million barrels and a scheduled processing rate of the Pyrenees FPSO of 96 kb/d (5.4 GL pa) we would get 120 mb / 96 kb/d x 365 days = 3.4 years.


Conclusion: Barring new substantial discoveries, WA’s crude oil has entered its last quarter. As extraction rates in new fields are very high (offshore environment) depletion levels will increase by between 3-4% pa on current trends to reach around 85% – 90% by 2015. This will dramatically worsen Australia’s net oil import balance. Given that global crude oil exports have already peaked in 2005 there is a major oil import crisis ahead. Neither banks – who are still financing new tollway projects like the M2 widening in Sydney – nor the general public have been properly informed about these facts.


Key data & graphs

  • Net oil importers
  • Oil Exports
  • Crude oil imports
  • Downloads
  • Latest Graphs
  • Oil price analysis
  • US drilling rig count
  • International drilling rig count
  • Australian fuel prices
  • Diary
  • International oil companies
  • US tight oil production
  • China peak oil
  • World liquids supply – demand balance
  • Tankers arriving and departing in Sydney
  • Australian oil and fuel imports

Latest posts

  • Asia Pacific peak oil update 2025, consumption 5x higher than production
  • Australian jet fuel stock floating offshore while fuel prices are flying away
  • Australian Diesel imports in August dropped from high in May
  • First early hot summer day in spring 2026 and power prices spike at a whopping AUD 23k per MWh
  • Energy Minister Bowen firm in refusing Russian fuel imports but keeps options open for diesel imports from Russian dependent India
  • Australian Energy Minister Bowen downplays diesel supply risk after Saudi Arabia visit

Archives

©2026 Crude Oil Peak | Design: Newspaperly WordPress Theme